Guides
TUI Usage
Navigate Overview, Deep Dive, Usage, Coach, and Scrollback plus filters, keyboard shortcuts, session drill-down, and reports.
TUI gallery
Terminal UI screens.
Five tabs plus session and config
TUI Usage
The terminal UI is the default tokenuse experience. It scans local session files, stores normalized calls in <config dir>/tokenuse/archive.db, and renders spend by day, project, tool, model, shell command, and MCP server.
tokenuseIf no local sessions are found, or archive sync fails before any calls are loaded, the app falls back to bundled JSON sample data and shows that status in the title bar.
Launch with tokenuse --sample to start with bundled sample data even when local sessions exist. The live snapshot remains cached, so Shift-D switches back to it without another startup load.
Two scriptable commands summarize the archive without launching the TUI. tokenuse status prints one line with rolling-24-hour and calendar-month totals (cost, calls, sessions). tokenuse overview prints a copy-pasteable summary of this month: totals, tokens, per-tool spend, top models, top projects, and a chronological daily table. Both use the configured display currency, emit plain deterministic text (no ANSI), sync the archive the same way --list-projects does, and accept --json — status --json carries raw numeric totals alongside display values, overview --json additionally embeds the full dashboard payload for piping into jq.
tokenuse mcp runs a read-only MCP (Model Context Protocol) server over stdio for LLM clients such as Claude Code — newline-delimited JSON-RPC on stdin/stdout, no network, no extra process left behind. It exposes four tools: status (today and calendar-month totals), overview (this month’s totals, per-tool split, activity categories, models, daily trend), projects (this month’s per-project spend), and scrollback (full-text search over archived session transcripts). scrollback takes a required query — terms are ANDed and the final term matches by prefix — plus optional project (a project name, a pseudonym from the projects tool, or a raw identity), tool (a tool id such as claude-code or codex), and limit (1–50 matching sessions, default 20). Results are grouped per session with the tool, project label, last timestamp, cost, match count, a prompt-only flag, and up to three plain-text snippets tagged with role and timestamp; a blank query is a tool error and never touches the archive. Project names are pseudonymised with a salted hash by default — the salt persists at <config dir>/tokenuse/mcp-salt so pseudonyms stay stable across restarts — and --real-names disables the mapping; scrollback project labels follow the same pseudonymisation, while its snippets are raw transcript text, since the client is reading its own local sessions. Register it with an MCP client as command tokenuse, args ["mcp"]. Data syncs the archive on first use and refreshes at most every 15 minutes for the lifetime of the server process.
tokenuse mcp --http [--port N] [--real-names] serves the same four tools over Streamable HTTP instead of stdio, in the foreground until interrupted. The listener binds 127.0.0.1 only (default port 20151; --port overrides the port saved in config.json, and the desktop app’s MCP Server panel hosts the same endpoint in the background). Every request must send Authorization: Bearer <token>; the token is created on first use at <config dir>/tokenuse/mcp-token, owner-readable only — delete the file to rotate it. Non-localhost Host or Origin headers are rejected, so other machines and browser pages cannot reach the endpoint. Register it with an HTTP-capable client, for example:
claude mcp add --transport http tokenuse http://127.0.0.1:20151/mcp \
  --header "Authorization: Bearer $(cat <config dir>/tokenuse/mcp-token)"
For the tool schemas, the HTTP security model, and internals, see the MCP server reference.
When a tool shows zero (or a number that looks wrong), tokenuse doctor explains why. For every tool adapter it prints the locations it probes and whether they exist, the environment overrides in effect, how many session and limit sources discovery found, and whether a bounded parse sample (up to 8 sources) succeeds, ending in a verdict: OK, NOTHING FOUND (with the likely cause), ERRORS (with the first parse error), or DISCOVERY FAILED. It runs read-only and never touches the archive; add --json for machine-readable output.
Dashboard
The dashboard shows:
- Summary totals for cost, calls, sessions, cache hit rate, input, output, cache reads, and cache writes.
- Daily cost and call activity.
- Spend by project and by project/tool pair.
- Top sessions and spend by model.
- Core tool calls, shell command heads, and MCP server usage.
Project names are normalized across tools. Absolute paths are folded to the nearest existing Git root when possible, then displayed with the shortest unique suffix.
Press g to cycle the dashboard sort mode between spend, latest date, and token use. The active sort applies to dashboard tables, pickers, the Usage page ordering, and session call rows.
Press m to open a typeable model picker, mirroring the p project picker: selecting a model scopes Overview and Deep Dive (and the s session picker) to that one canonical model, and the title bar shows the active model next to the project filter. Pick All to clear it. The tool, project, and model filters compose — each narrows the same underlying call set independently.
Pages
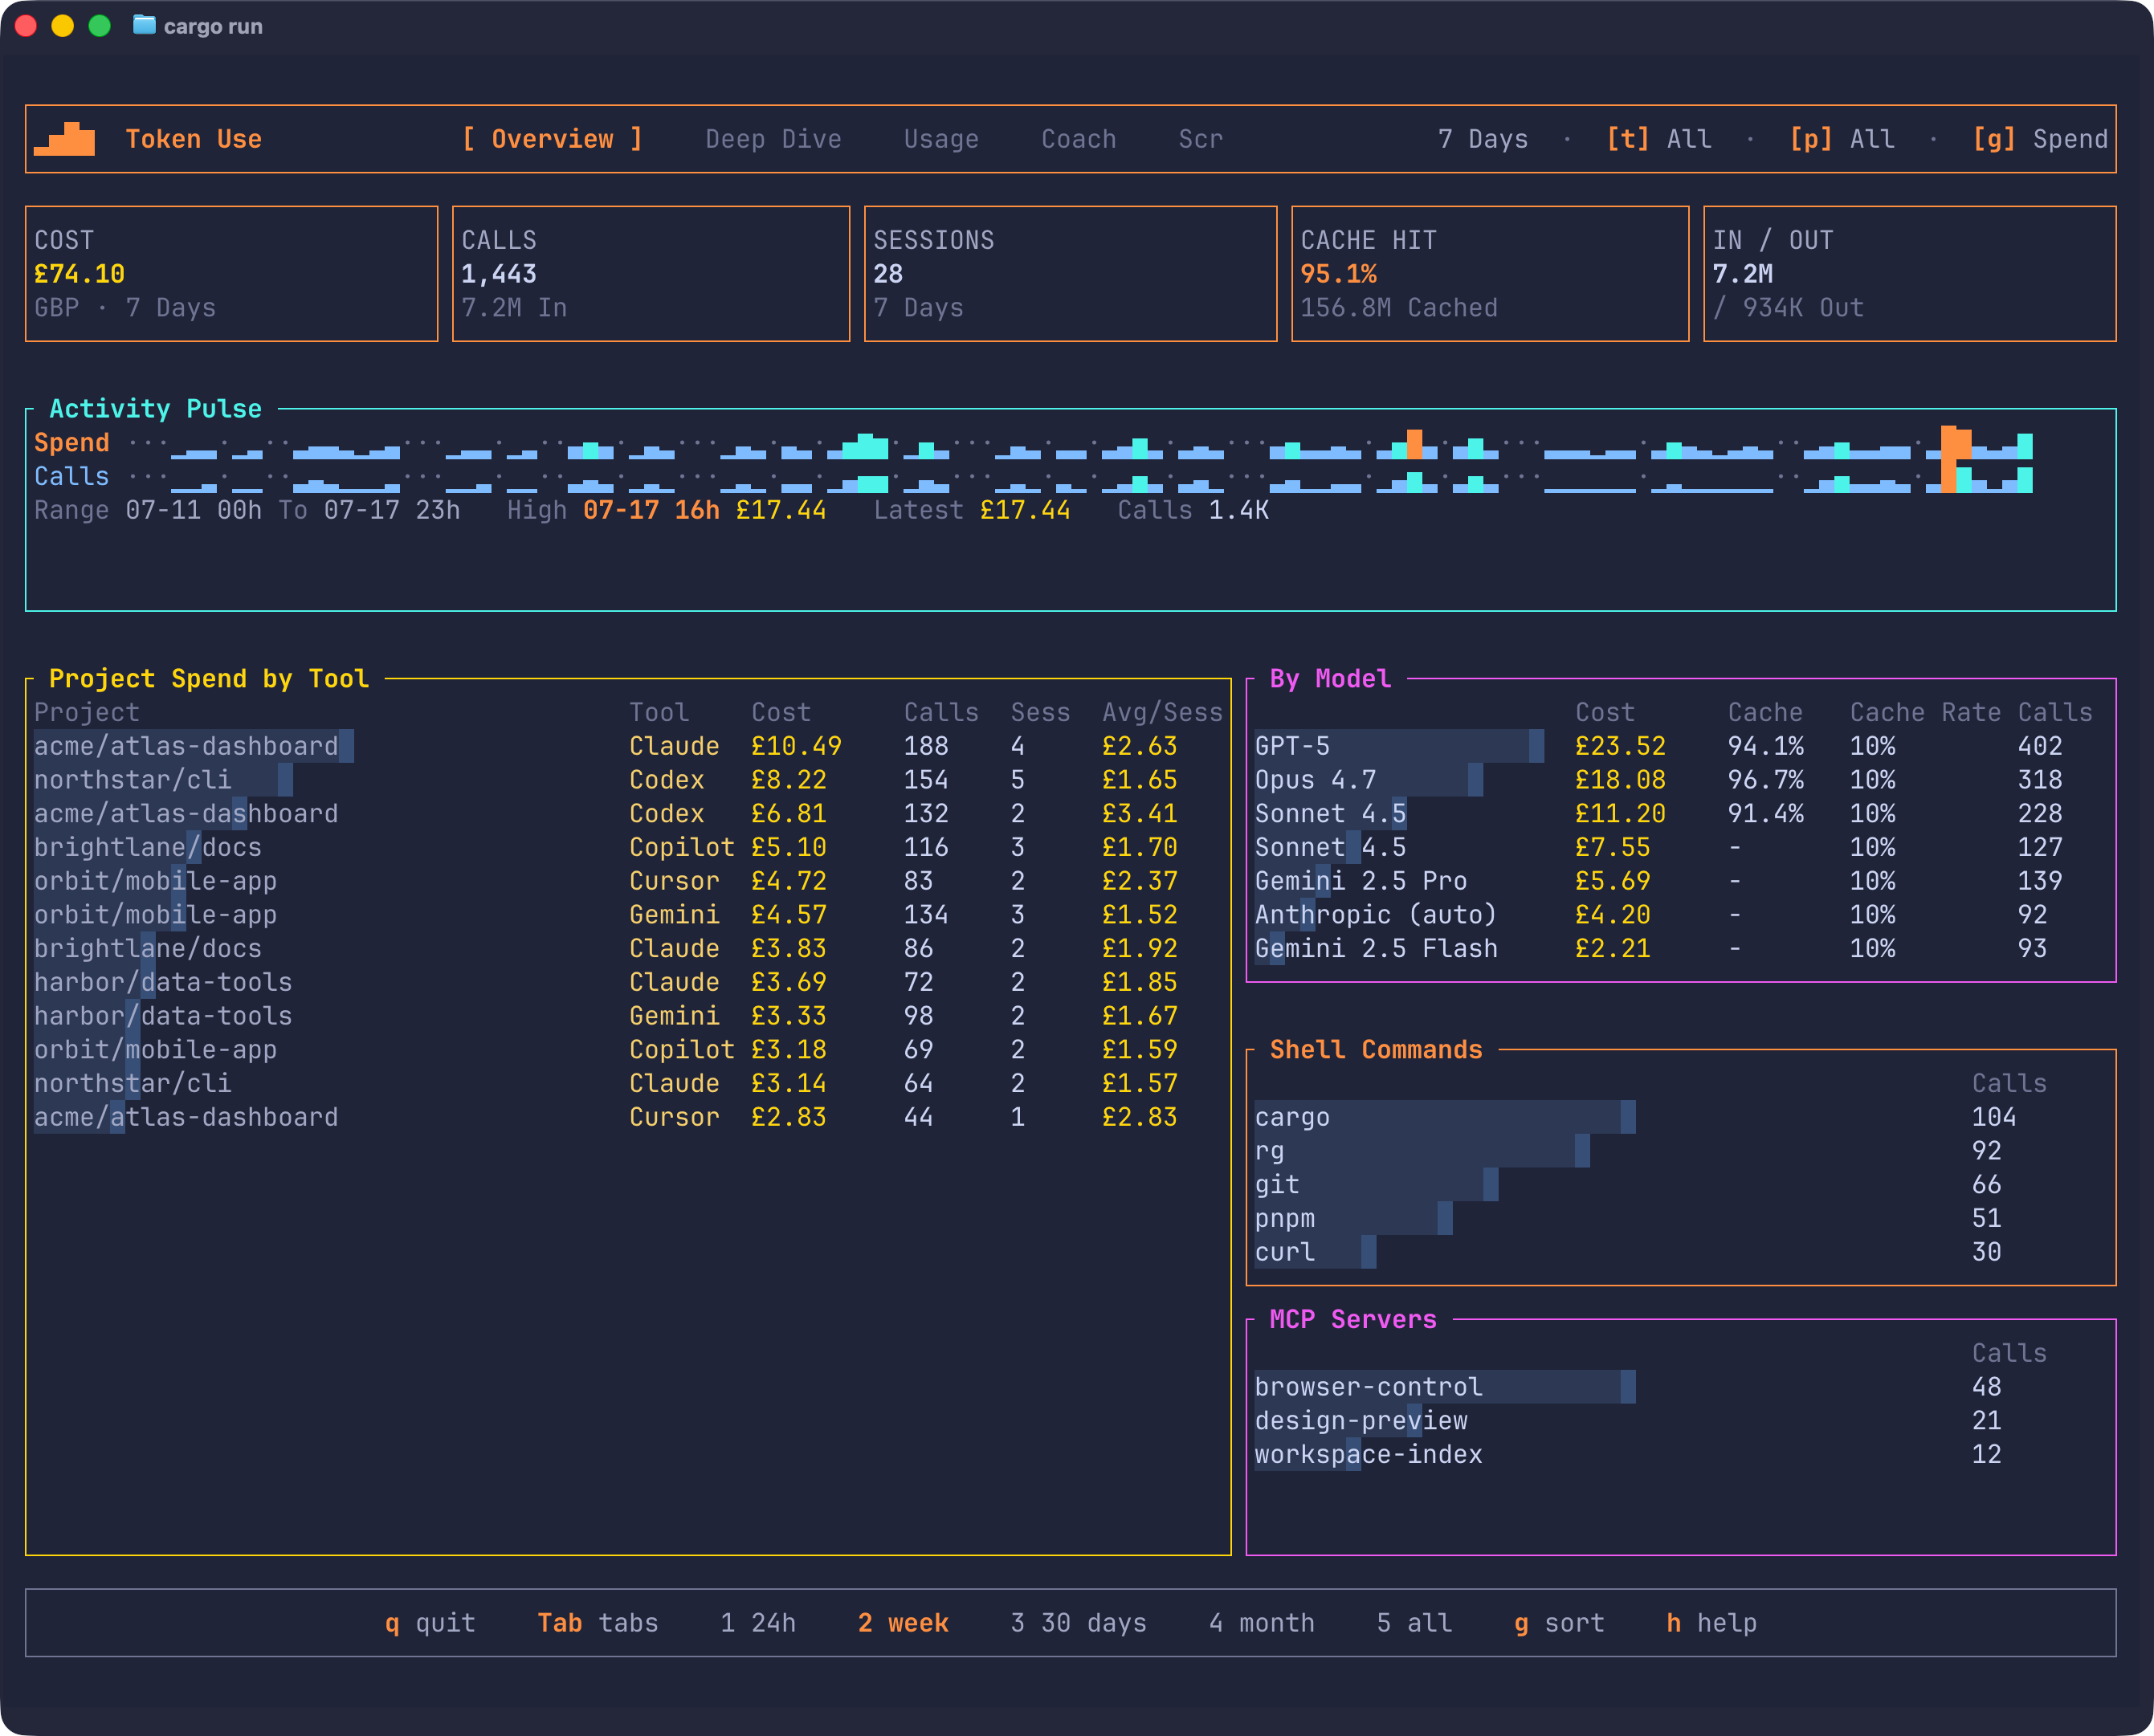
- Overview: the everyday command center with KPIs, an activity pulse graph, project/tool spend, model spend, shell commands, and MCP servers.
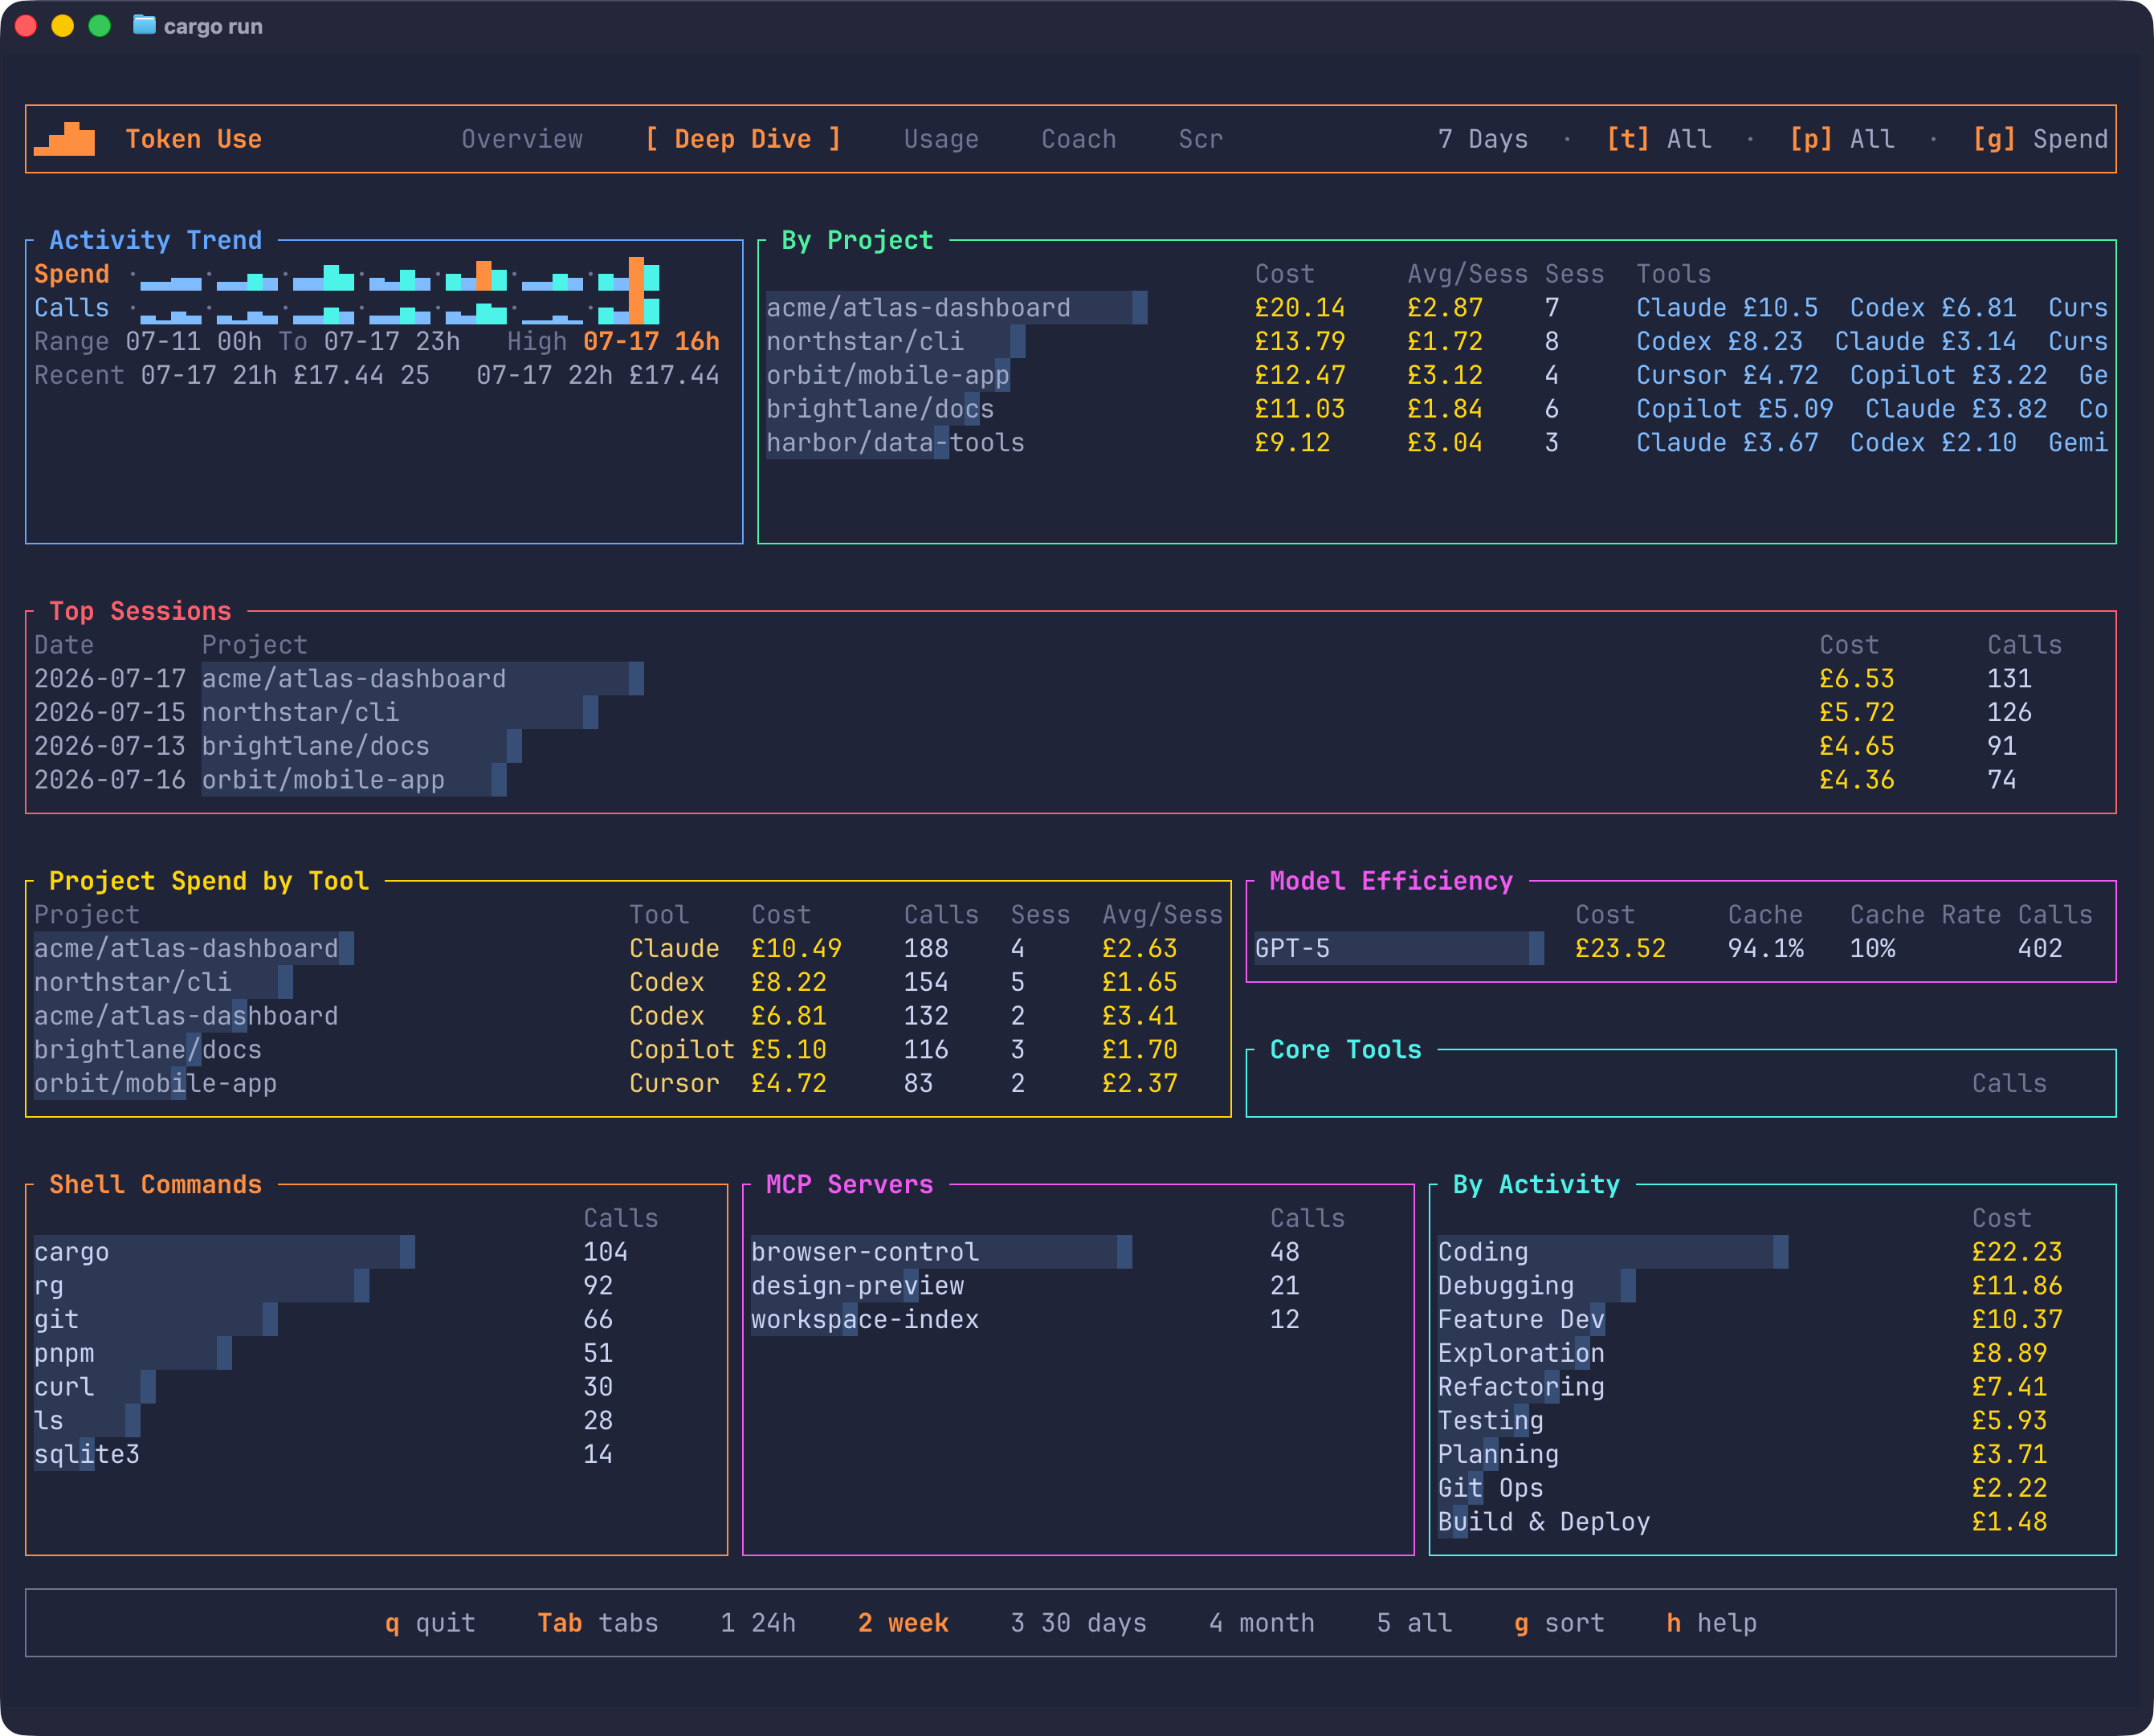
- Deep Dive: the analysis workbench with the full panel set, a larger chronological activity trend, top sessions, project rankings, model efficiency, core tools, shell commands, MCP servers, and a By Activity panel ranking spend across the deterministic task categories.
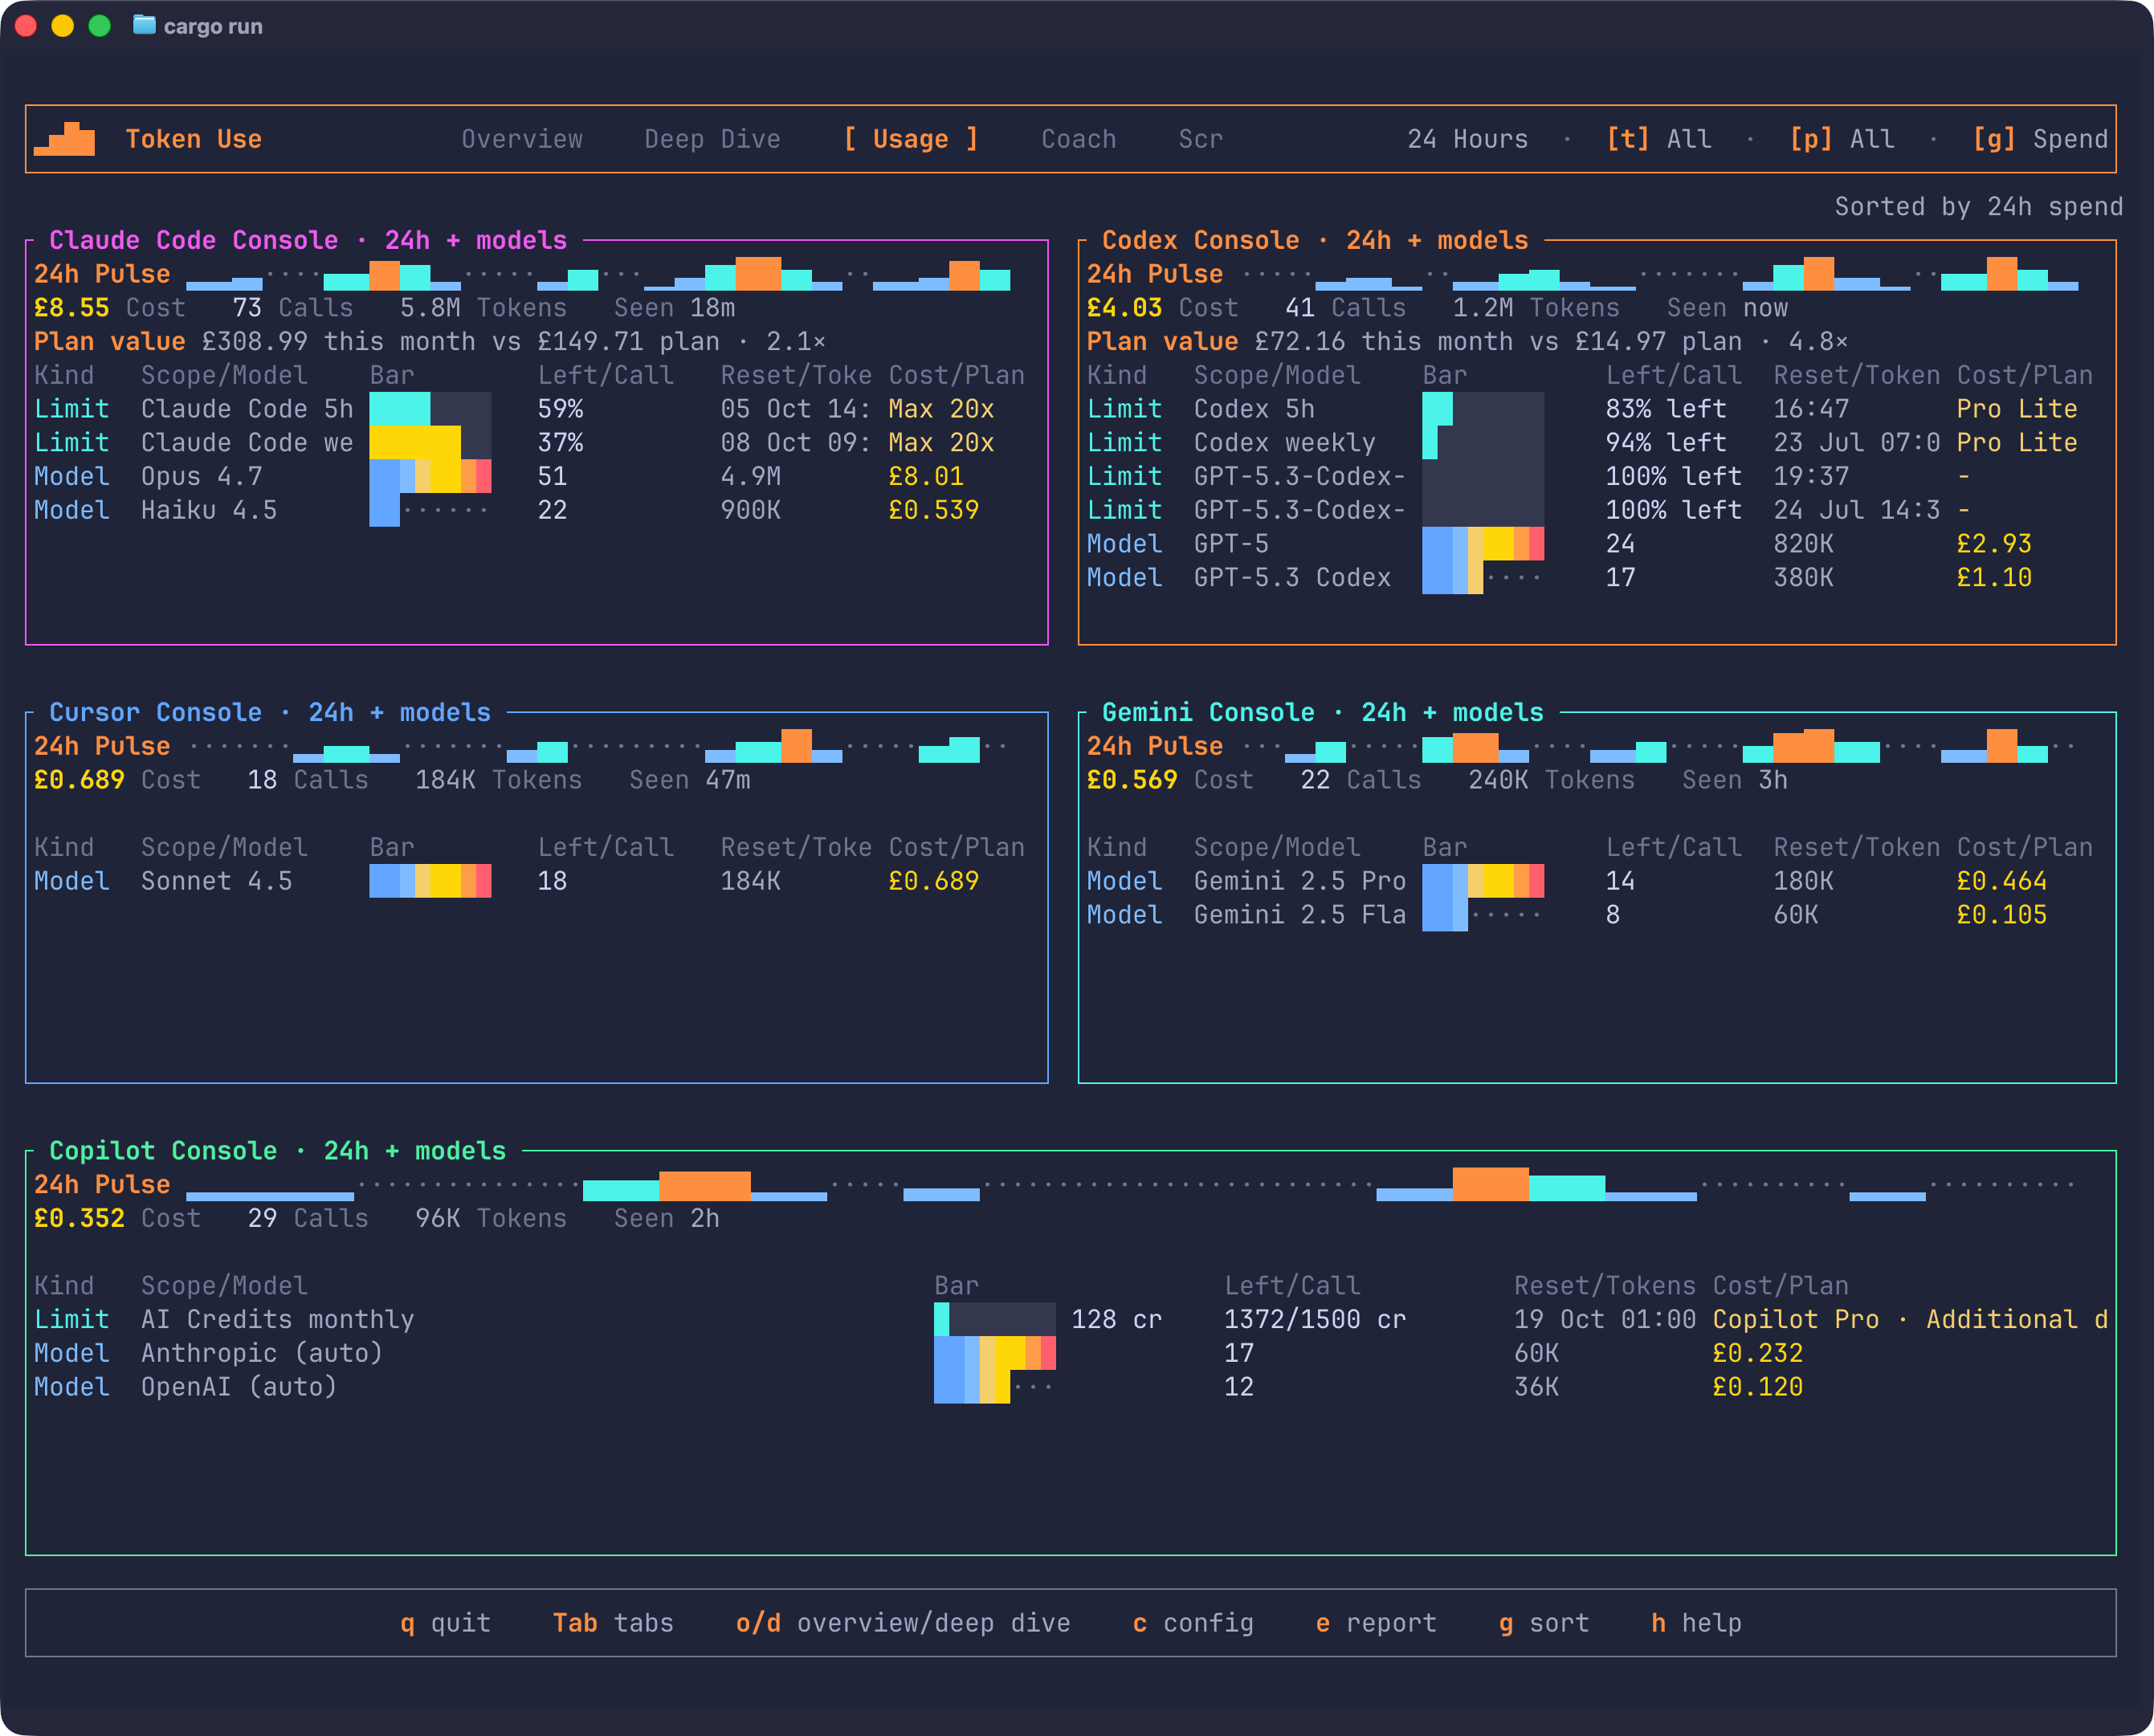
- Usage: rolling 24-hour per-tool consoles with a prominent pulse graph, calls/tokens/cost/last-seen totals, optional rate-limit gauges, and top models. When a subscription price is known (a
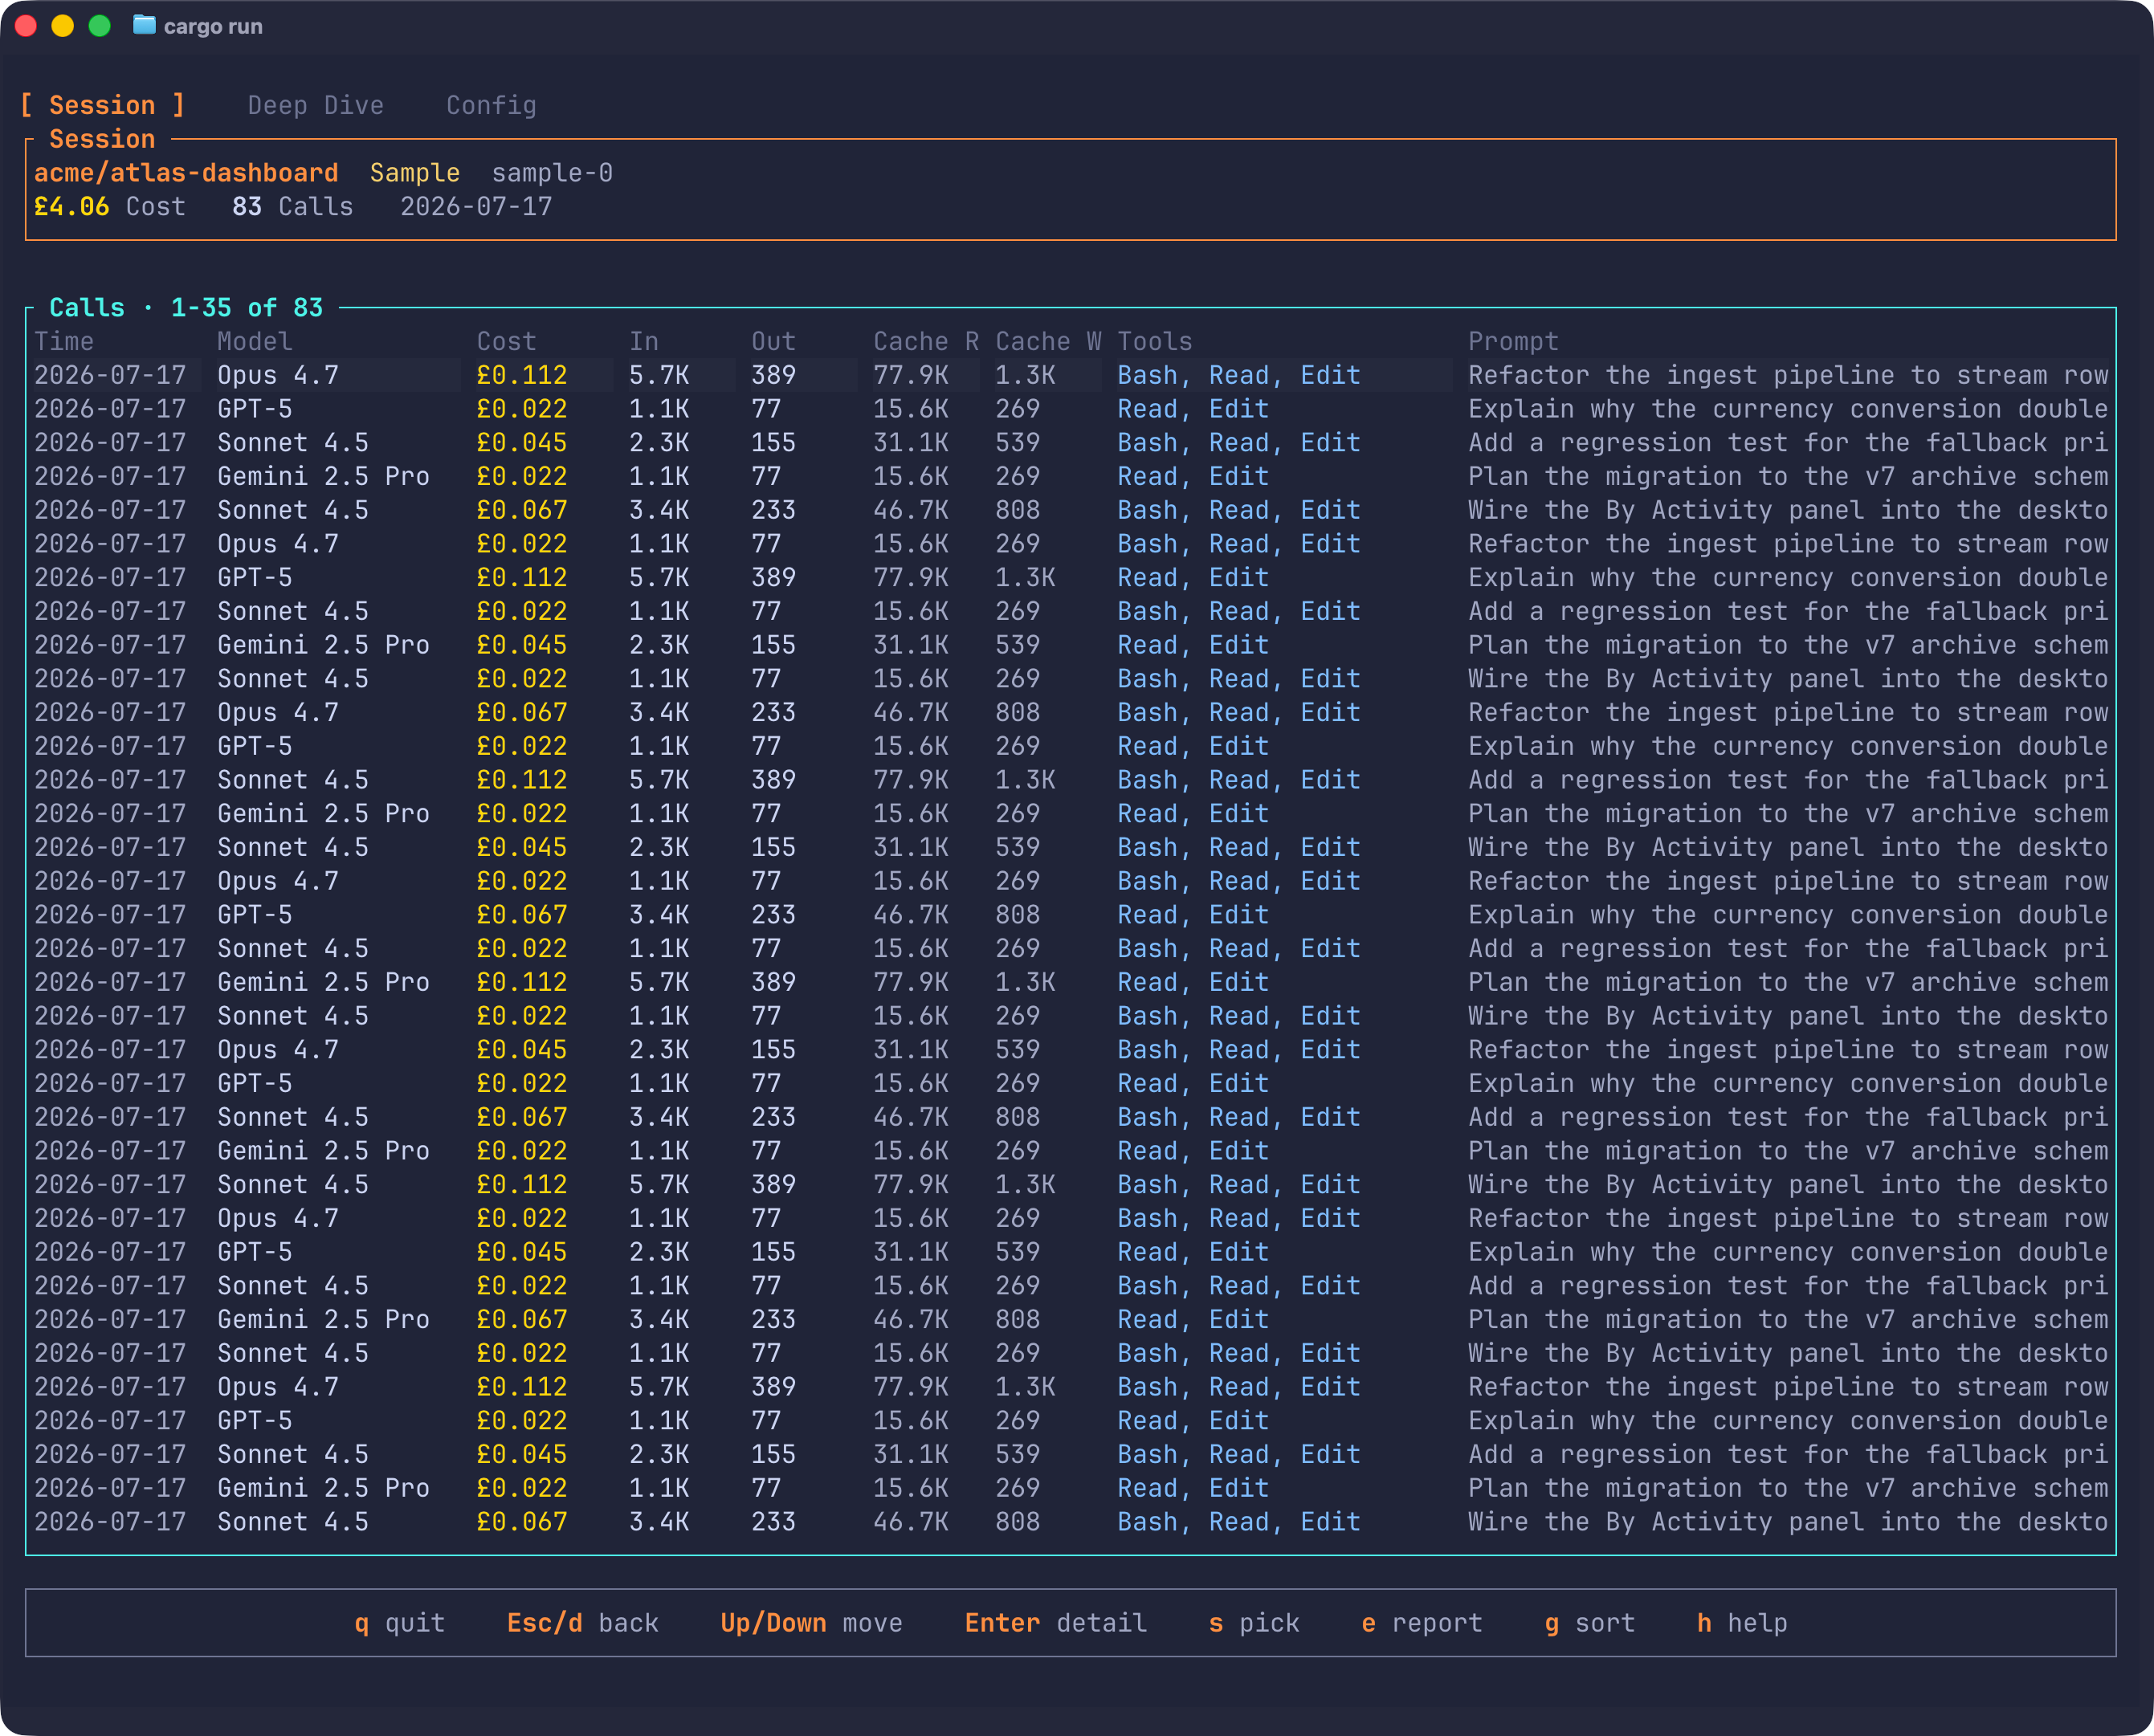
plan_pricesentry inconfig.jsonmapping tool id to monthly USD price, or a detected ChatGPT/Copilot self-paid plan), the console header adds a plan-value line comparing the month’s API-equivalent spend against the plan price. Opening this tab automatically selects the 24 Hours period so the visible filter matches the console window. - Session: drill into one
tool:session_id, inspect per-call timestamp, model, cost, token buckets, tools, and prompt snippet, then open a call detail modal for the full stored prompt, cache price rates, and metadata. - Coach: the practice report card — overall grade, per-group scores (Prompt Quality, Session Hygiene, Code Review, Tool Mastery), the triggered findings with their occurrence lines, and the advisory Setup panel. The same data and copy as the desktop Coach page, honouring the active period, tool, and project filters.
- Scrollback: full-text search across every archived session transcript. Press
/to open it with the search input focused, type a phrase, and press Enter; results group per session with highlighted snippets, and Enter drills into the matching session. See Scrollback. - Config: display currency, confirmed local downloads for currency rates and pricing books, and a confirmed clear-data action that rebuilds the archive.
Tab Guide
Overview is the fast read. Start there when you want to know whether current spend is normal, which project/tool pair is hot, and which models, commands, or MCP servers are shaping the session mix. The Activity Pulse graph is chronological and ignores the active table sort, so the line keeps showing usage over time even when ranked tables are sorted by spend, date, or tokens.
Deep Dive is the comparison view. The Activity Trend panel uses the same chronological timeline as Overview, then the surrounding tables rank projects, project/tool pairs, sessions, models, tools, commands, MCP servers, and task-category spend (By Activity) by the active sort. Ranked rows show their relative magnitude as a muted background wash behind the name cell (with a brighter terminus cell marking the value) instead of a separate meter column, leaving the column width to the names themselves. Use it when you need to explain why a period changed or decide which project/session to inspect next. Clicking a Top Sessions row jumps straight into that session’s page, the same drill-down the s picker reaches; clicking a By Project row applies that project as the active filter (click it again to clear back to All), matching the p picker.
Usage is the live capacity view. Each tool gets its own console, and entering the tab switches the visible period selector to 24 Hours. The 24h pulse line shows hourly relative activity for that tool, followed by totals for calls, tokens, cost, and last seen. Limit rows are gauges from imported plan snapshots when available; model rows are ranked bars for that tool’s rolling 24-hour slice. A limit row whose reset time has already passed (or whose snapshot is more than a week old, for windows without a reset) dims and swaps its reset time for an as of <date> · stale note; after a further week it drops off the console entirely. Reports and exports keep the full snapshot history.
Tools with no current limits or model activity remain visible with an explicit idle row. Empty ranked panels likewise show an explanatory row instead of an unlabelled blank box.
Activity Pulse and Activity Trend use hourly buckets for 24 Hours and 7 Days. This Month also uses hourly buckets during the first 14 days of the month, then switches to daily buckets from the 15th onward. 30 Days and All Time use daily buckets. The 24 Hours period is rolling from the current time, not a calendar-day midnight cutoff. Graph bars and pulse lines are relative to the visible panel. They are designed for quick comparison inside the terminal, not exact accounting; use the adjacent numeric columns for exact cost, call, token, reset, and plan values.
Keyboard
The keyboard reference, footer hints, and TUI shortcut behavior come from the embedded keymap. The help overlay uses two columns so the complete reference fits at the supported 120x40 minimum.
| Key | Action |
|---|---|
q |
Quit |
Esc |
Close modal or go back from a sub-page |
1-5 |
Period: 24 hours, 7 days, 30 days, this month, all time |
t |
Cycle tool filter |
g |
Cycle sort mode: spend, latest date, token use |
Shift-D |
Toggle between live and sample data |
p |
Open project picker |
m |
Open model picker |
Tab / Shift-Tab |
Cycle Overview, Deep Dive, Usage, Coach, and Scrollback |
o |
Open Overview |
d |
Open Deep Dive |
u |
Open Usage / rate limits |
k |
Open the Coach practice report |
/ |
Open Scrollback transcript search |
c |
Open Configuration |
s |
Open session picker and drill into a single session |
e |
Generate a project or all-projects report |
f / b in report modal |
Choose another report folder for this session |
r |
Sync the local archive in place |
h or ? |
Open the keybinding reference |
In the session page, use Up / Down, PgUp / PgDn, Home / End to move through calls, Enter or a mouse click to open call details, and Esc or d to return to the page that opened the session — Deep Dive for its Top Sessions rows and the s picker, Scrollback for search results. On Deep Dive, a mouse click on a Top Sessions row opens that session’s page directly. In pickers and configuration, use Up / Down, Home / End, Enter, and Esc.
Usage Page
The Usage page is always a rolling 24-hour view. Opening it automatically selects the 24 Hours period. The page ignores project and model filters and renders all tool console sections so plan-limit gauges stay comparable across tools. The active sort mode controls the order of tool sections and model rows; rate-limit rows keep their scope/window order.
Each tool section includes:
- One 24-hour pulse graph plus calls, tokens, cost, and last seen time.
- Zero or more limit gauge rows from imported
LimitSnapshotrecords. Codex imports snapshots from rollout JSONL; Claude Code and Copilot import optional local sidecars from the tokenuse config directory. Copilot AI Credits rows show the exact used and remaining/total credit counts, reset time, plan, and whether additional usage is enabled. - Up to three top model rows for that tool’s 24-hour slice.
Scrollback
Scrollback searches the full text of every archived session transcript — your prompts and the assistant’s replies, across all five tools. Press / from any page (or Tab-cycle to the fifth tab) to open it with the search input focused; it is the TUI’s only page-level text input. Type a phrase and press Enter to run the search — nothing searches as you type. Matching is word-based: terms are ANDed, the final term matches by prefix (lifeti finds lifetimes), and there is no substring matching inside words.
While the input is focused, Backspace edits, Ctrl+U clears the query, and Esc leaves the input so the page keys work. With the input unfocused, / or Esc refocuses it, Up / Down (plus PgUp / PgDn, Home / End) move through the result groups, and Enter opens the selected session’s page. Esc from the session returns to Scrollback with the query and results intact — session pages return to whichever page opened them.
Results group per matching session, ranked best match first, with the project, tool, date, session cost, and match count in the header and up to three snippets below it, each tagged you or assistant with the matched terms highlighted; +N more matches in this session counts the rest. A prompt only badge marks sessions whose source files were already gone when transcript capture landed — only their stored 500-char prompts are searchable.
The search honours the global tool and project filters: t cycles the tool and p opens the project picker, and the filters apply the next time you run the search (press / then Enter to re-run). Searches read the live archive even in sample-data mode — the sample dataset has no transcript index, and the page notes this.
Transcript text lives in archive.db alongside the usage rows; the Config page’s Clear Data action is the way to purge it.
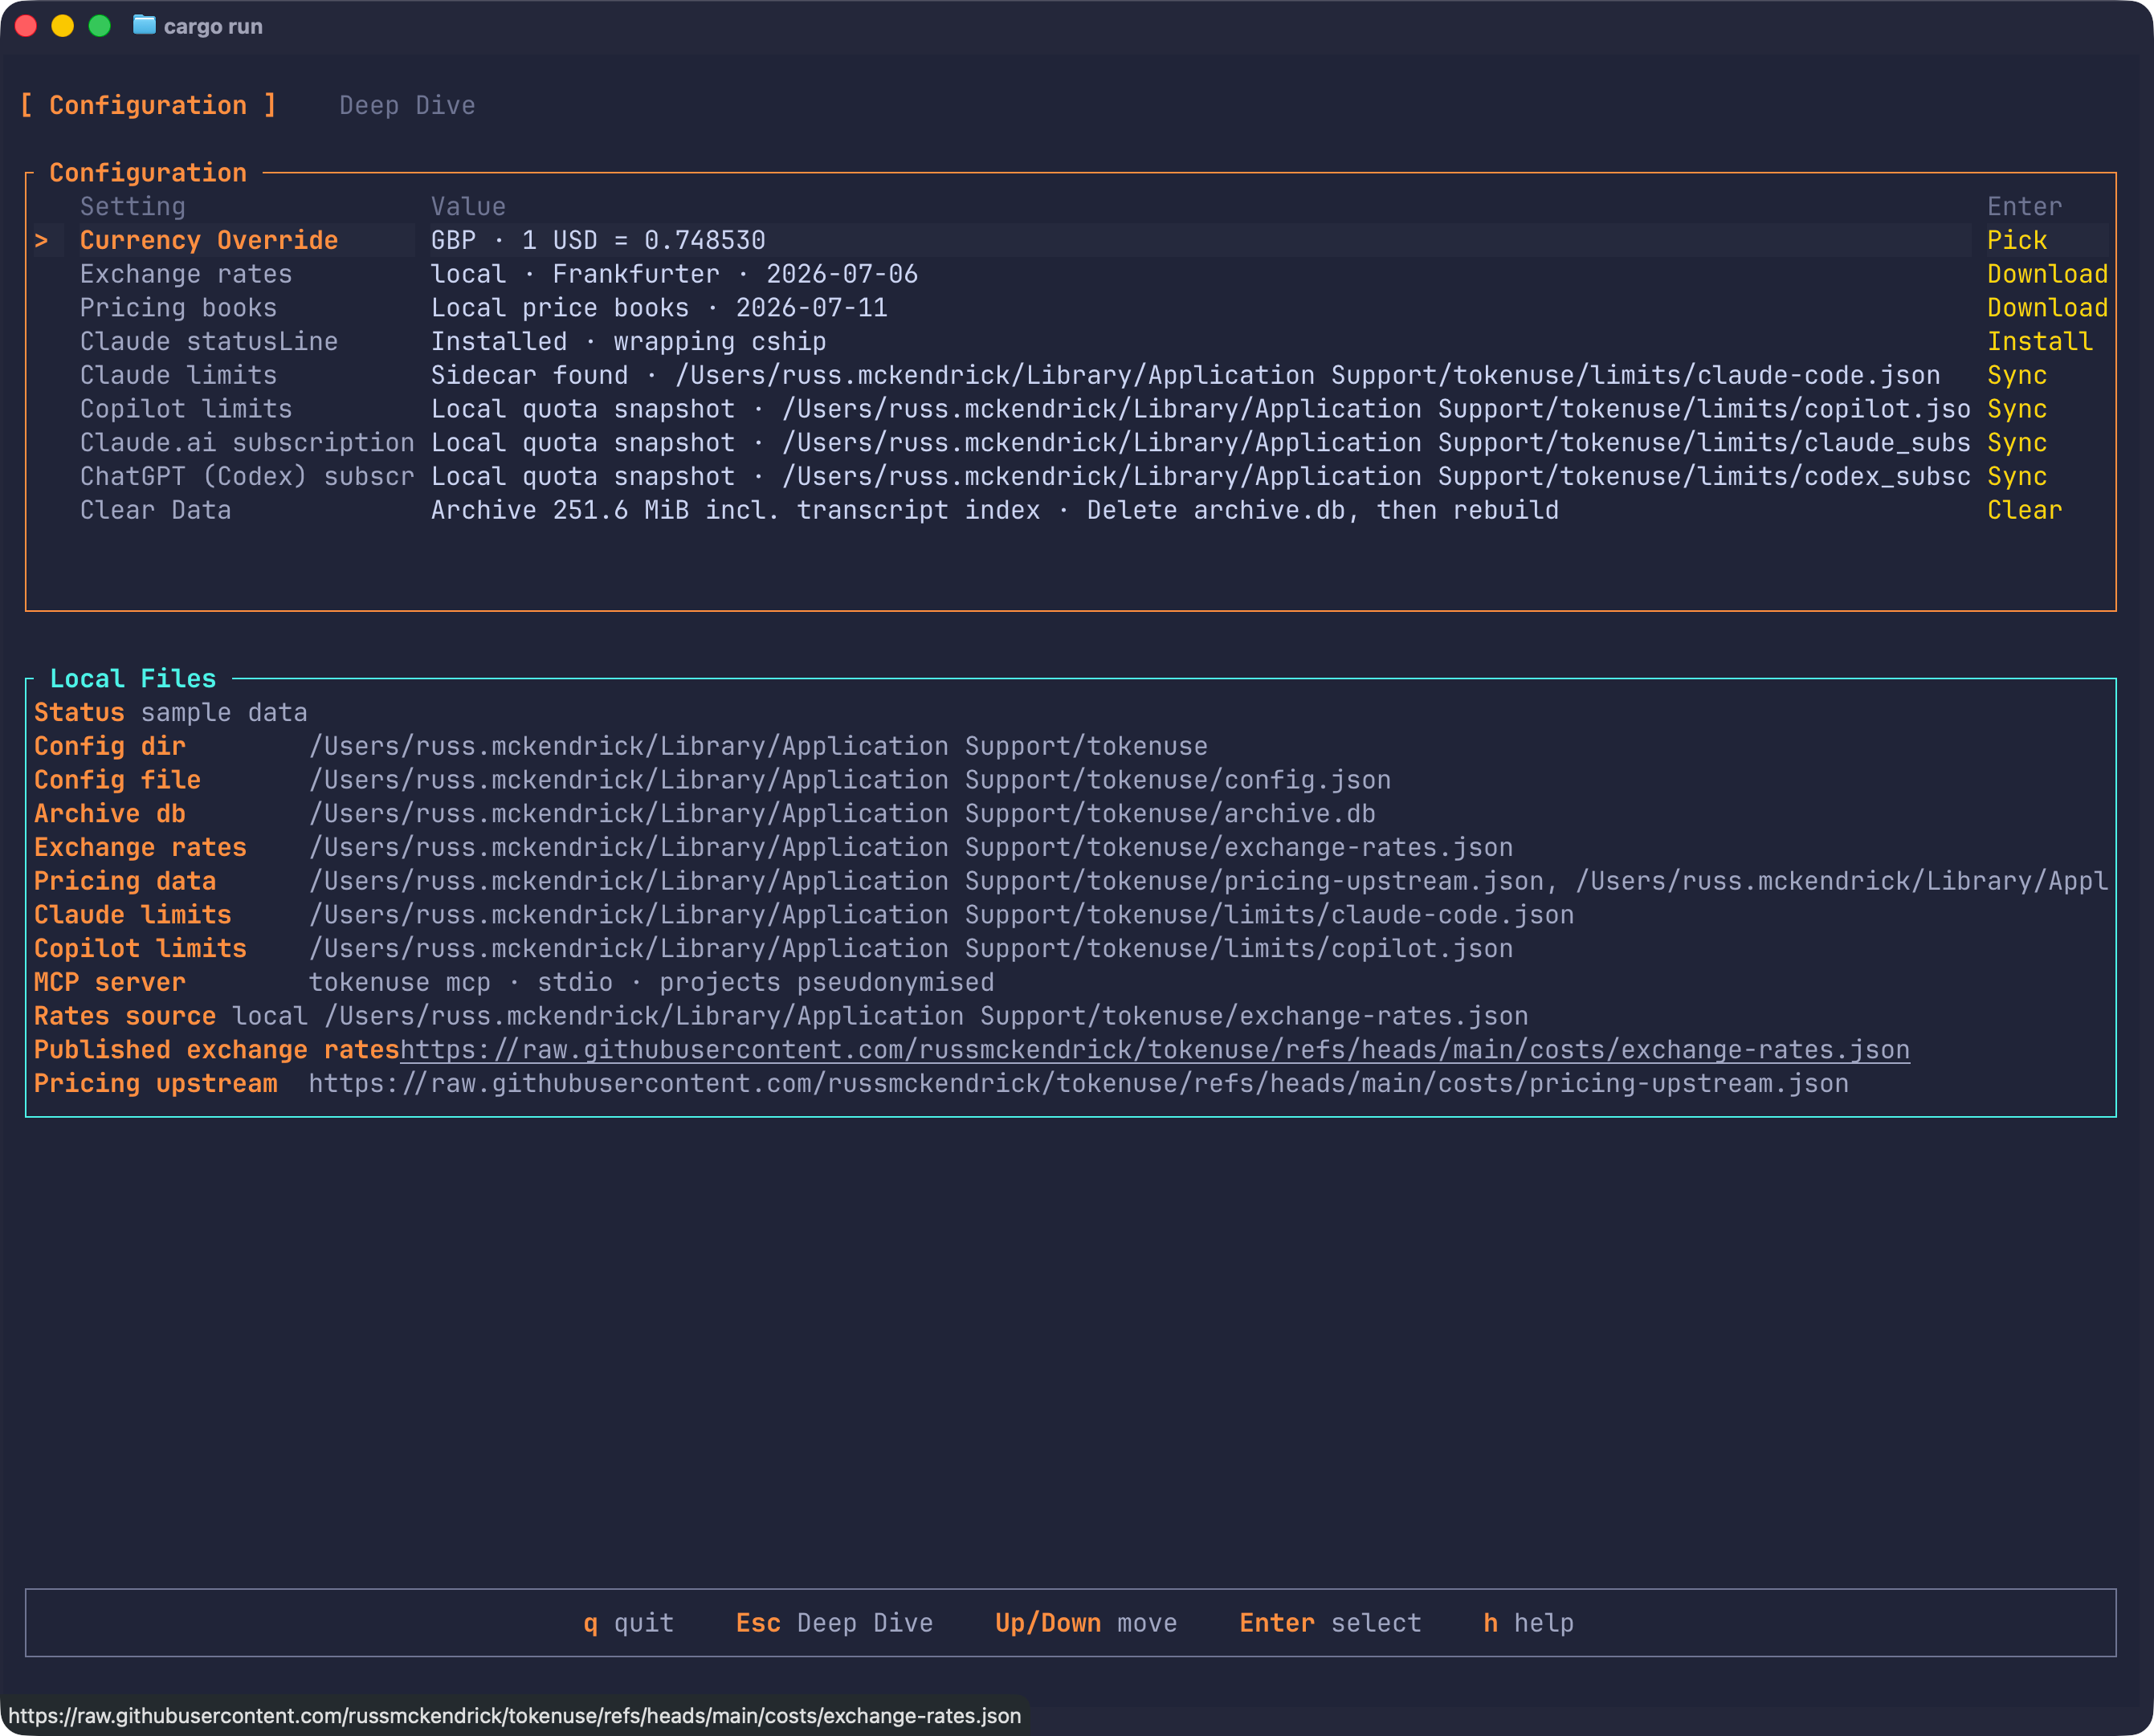
Configuration
Runtime settings live in the platform config directory under tokenuse:
| File / directory | Purpose |
|---|---|
config.json |
User overrides, currently display currency |
archive.db |
Durable local usage archive |
exchange-rates.json |
Optional local currency snapshot |
rates.json |
Legacy local currency snapshot |
pricing-upstream.json |
Optional local broad pricing book |
pricing-overrides.json |
Optional local official overrides and aliases |
pricing-snapshot.json |
Legacy local pricing snapshot |
limits/claude-code.json |
Optional Claude Code status-line limit sidecar |
limits/copilot.json |
Optional Copilot quota sidecar written by confirmed sync |
reports/ |
Fallback report directory |
USD remains the default display currency. Costs are calculated and stored internally as import-time USD, then converted for display using the configured currency.
The Config page lists the published rates and pricing book URLs next to the local file paths, so users can inspect exactly what the download actions fetch before confirming. The pricing row also shows the active book source and its latest checked/generated date. The Claude limits row imports an existing local sidecar and shows a setup hint until Claude Code’s statusLine writes the OS-specific sidecar path. The Copilot limits row asks for confirmation before reading local Copilot credentials and fetching current quota state from GitHub.
Pressing Enter on Claude.ai subscription quota or ChatGPT (Codex) subscription quota opens a Subscription cookie modal. Paste a sessionKey (Claude) or the two __Secure-next-auth.session-token shards plus optional extras (Codex), then pick Save & sync, Sync with stored cookie, or Clear stored cookie. Bracketed paste is enabled so long cookies arrive as a single chunk, the input is masked to •, and the sync runs on a worker thread so the TUI stays responsive. See docs/development/tools/claude-subscription.md and docs/development/tools/codex-subscription.md.
The Config page’s clear-data action asks for confirmation, deletes archive.db, and immediately reimports from local tool history. Config, exchange rates, pricing books, limit sidecars, legacy pricing snapshots, and reports are kept. Archive-only rows disappear if the original source files are gone, and rebuilt rows use the current configured pricing. Once archive.db exists, the row’s value leads with its current size (for example Archive 12.3 MiB incl. transcript index) — the archive also holds the Scrollback transcript index, and clearing data is the way to purge captured transcript text.
Reports
Press e on Overview, Deep Dive, Usage, or Session to generate a report. The report modal chooses format, period, project scope, and redaction. Reports always include all tools for the chosen period and project or all-projects scope. Output defaults to the user’s Downloads folder, falling back to ~/Downloads and then <config dir>/tokenuse/reports/.
Run tokenuse report to generate reports without opening the dashboard. The guided command asks for time range, project scope, one or more report formats, output folder, redaction, and final confirmation. It writes live local-session reports only; if no local sessions are found, it exits without generating sample reports.
Reports are timestamped and slugged with the chosen period and project scope, so prior runs are not overwritten. HTML/PDF are client-ready executive report decks, SVG/PNG are one-page executive visual summaries, JSON serializes the full report dataset, Excel writes a multi-sheet workbook, and CSV writes one file per report area.
| Format | Output |
|---|---|
| HTML | One self-contained executive report deck |
| One browserless A4 landscape render of the same executive deck | |
| SVG | One 16:9 visual summary with KPI strip, heatmap/trend, and top highlights |
| PNG | Same one-page visual summary as SVG, rasterized |
| JSON | One pretty-printed full report dataset |
| Excel | One multi-sheet workbook with summary and raw data sheets |
| CSV | One directory with one CSV per report area |